Global Macro Trading for Idiots
Part One: Trading the US Yield Curve
Since I have been posting about curve trades and treasury future butterflies in the chat recently, I’ve gotten a few of questions about how/why to implement them. While they’re certainly a strategy that should be employed by more sophisticated investors, understanding the yield curve is an essential part of understanding the significance of bond market signals that apply to the broader economy and curve trades can provide payoffs for specific economic scenarios that are hard to find elsewhere.
If you’re already a paid subscriber that knows how trading the curve works, skip to the end for an update on the position mentioned in the chat back on July 14th.
So, with that said, I’d like to introduce you to the first installation of my series:
Global Macro Trading for Idiots
Part One: Trading the US Yield Curve
Playing shifts in the shape of the yield curve can be an excellent way to express your view on the economy and the monetary/fiscal response to it without having to worry about idiosyncrasies in markets like commodities or stocks. In order to do so, there are a few things you need to understand:
The way the yield curve moves in response to various economic, monetary and fiscal developments
The relationship between price and yield across various durations of treasuries (called “tenors”)
How to ensure you are actually playing the curve in a manner that results in your PnL moving a set amount for not the changes in individual bond yields but rather the change in the value (measured in basis points) of the yield curve.
Once these things are known, it’s relatively simple to add a new strategy to your repertoire that can present significantly asymmetric opportunities and afford you a dynamic way to hedge equity or commodity bets. Since this is the first installment of “macro for idiots”1, I will not be going into things like carry, roll, flys etc. The purpose of this article is solely for beginners to understand how these moves work and how to make use of them in understanding what signals the bond market is sending. It should also help investors understand why the signals sent by the yield curve have historically held significance in economic forecasts and why they may be wrong in unique situations.
Remember that the “normal” state of the yield curve is for there to be a “term premium” on longer durations, essentially a higher yield promised to investors for their willingness to lock up their money for longer periods of time and take the risk that interest rates may change during the duration of the bond.
So let’s look at a curve.
The above yield curve is “normal”. Banks borrowing short and lending long love it. And savers get rewarded with higher yields for locking up their money for longer. It works.
Keep this shape in mind when we’re discussing the curve, with one caveat. When we are talking about “steepeners” or “flatteners” in the context of the curve already being inverted, do not think of this shape or else you will get them backwards2. It’s much more simple to think of the curve when those terms are being used as a graph with the X axis being time (not duration) and the Y axis being the difference of [longer yield] minus [shorter yield].
This will become apparent later but just think of it this way: when someone says “yield curve” think shape and when someone mentions a *specific* yield curve, like 2s10s, think 10 year yield minus 2 year yield plotted like this:
If this line is going UP, it’s a “steepener”
If this line is going DOWN, it’s a “flattener”
So what’s all this “steepener” and “flattener” talk anyway.
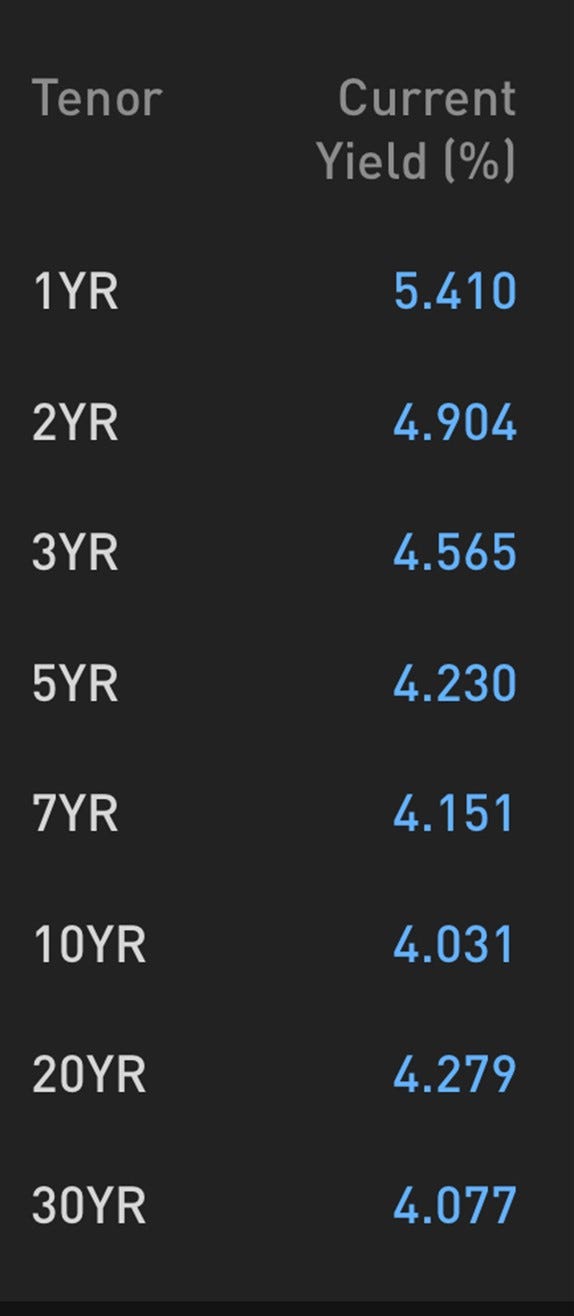
Well, here’s what yields are right now:
And here’s a comparison of what the yield curve looks like right now versus how it looked 90 days in the past and 360 days in the past:
360 days ago, the yield curve was “normal”, then as you can see the yield curve now and 90 days ago is “inverted” or downward sloping. The extent to which the change increases the difference between the yields of the short vs long tenor determines whether it has flattened or steepened, and the overall direction the curve is heading in absolute terms (for example, here the curve currently has higher yields across all tenors than it did 90 days ago) determines whether the move is a “bear” or “bull”.
This is YIELD and THE PRICE OF A BOND MOVES INVERSELY WITH THE YIELD. Higher yields are bearish for bonds. Thus, this represents a “bear flattening”.
That means you would have made money over the last 90 days if you were either short bonds (any tenor, in this case, but specifically it refers to the tenors of the curve being referred to) or if you were selling short duration and buying longer duration
That’s not the case with the past 30 days! Check it out:
So let’s examine the 2s10s. I’ve drawn lines in blue to represent where the yields are today for 2yr and 10yr (dashed) and then in orange to represent where yields were in early July for 2yr and 10yr (dotted).
So, today minus 30 days ago, for 2 year: 4.904 - 4.704 = +20bpsToday minus 30 days ago, for 10 year:4.094 - 3.716 = +37.8bpsTen year treasuries have sold off to the tune of nearly 38 basis points higher yields. Two year treasuries have also moved higher, but only by about 20 basis points.
The past month has been bearish for rates in both tenors. (Yes, even though interest rates are higher, the terminology that’s used and that you should use so you can speak about this stuff is higher yields = bearish rates and lower yields = bullish rates).
What’s the direction of rates across this curve?
Well, both of the differences are positive. So the move has resulted in higher yields, therefore we know it is a “bear _something_”.
Now for the second part. Has the curve moved in the direction of longer term yields being higher than shorter term yields?
We just subtract the move in rates for the shorter tenor from the move in rates for the longer tenor:
Ten year difference minus Two year difference =37.8-20=+17.8bpsSo that means the curve is steeper. Over the past 30 days, in the US 2s10s yield curve, there has been a bear steepener.
Fun, right?
Now let’s get into
FOR THE LOVE OF GOD, WHY DOES THIS MATTER?
Quick recap, here are the ways a yield curve between two tenors can move:
These shifts are often influenced by a complex interplay of factors including monetary policy expectations, economic outlook, inflation expectations, and global investment flows that I could never hope to explain in a substack post titled “macro for idiots” BUT that doesn’t mean I can’t try.
Why does the curved yield curve?
As we’ve established, the yield curve is the difference between the yield to maturity on two different "tenors" (or durations) of bonds. When the economy is functioning normally, the yield curve is "steep", i.e. the difference between the short duration tenors and longer duration tenors is positive (the curve slopes upwards).
When the economy is more likely to go into a recession because the fed is expected to hike rates (which translate in a diminishing fashion along the curve, i.e. 50pts of hikes expected in the next 6 months may result in 40bps higher 2 year yields but only 5bps higher 30 year yields), the yield curve "flattens" into an inverted shape, or the yield on the shorter durations and longer become closer together. The extreme version of this is a yield curve inversion, which is accepted to generally be a predictor of recessions (which has not been a great indicator of recessions thus far - there’s plenty to discuss about why or if it’s just relatively early this time but this article is about trading).
The 12/22 → Present Yield Curve Inverting Bear Flattener (this is what it sounds like…when curves cry)
It’s helpful to think about the yield of a bond as the market’s aggregate mean estimate of what the policy rate will be throughout the life of the bond and what the premium on that duration will be throughout the life of the bond - as the Fed hikes, the chances that the Fed Funds rate will average a lower number than it is at current become higher over the next 30 years, but can become much lower over the next 2 years. The other consideration here, of course, is the inflation rate. Nobody feels enticed towards earning 4% when inflation is going to average 5% over the life of the bond!
When central banks begin tightening rates to bring inflation down, the yield curve begins to flatten (and sometimes invert, depending on how concerned about a recession investors are). Rate increases are priced in to the front end of the curve while future expectation that interest rates will be cut are priced in further along the curve and expectations for demand for shorter duration treasuries drop as those tenors tend to most closely track the policy rate. Bonds in general are sold as investors anticipate rate hikes, but with a premium on the price of longer duration bonds as investors attempt to anticipate a recession.
When this dynamic plays out as the Fed is raising rates (perhaps the reason investors anticipate the recession in the first place) the yield curve “flattens” as rates on the short end increase faster and higher than the long end. This is the “bear flattener” that we witnessed in 2021-2022 resulting in a historic yield curve inversion. When inflation stays persistent and rate hike forecasts continue to be priced into the front end of the curve (and rate cuts continue to get priced out further out on the curve) this is the result.
If something crazy happens, like the banks collapse in a way that’s bearish for the economy (not like the new “insanely bullish bank failure” dynamic of 2023), you might be thinking a few things as an investor:
“Wow, this is going to be bad for the economy and therefore bad for stocks. I do not want counterparty risk. I will move my holdings to cash and use that cash to buy treasuries”
“If stocks go down a ton, I want to have money available to buy them. I don’t want to tie up all this money when I can be buying NVDA at 0.5x earnings in 6 months - I will buy more short term government obligations like two year notes and shorter.”
“In fact, maybe I’ll just lever up on the 2 year notes. They yield a lot more than the long bond. And, after all, this massive development will surely force the Fed to cut interest rates to zero in the next 3 months, meaning that the average yield over the next 2 years will end up being more like 50 basis points!”
“If I’m right, I can make more money buying a lot of 2 year notes at a fixed rate on margin, because margin is floating rate and the fed is going to cut rates and 2 year treasuries do not have as much price volatility as 10 year or longer (more on this later) which means I can buy way more of them.”
“If we do have a recession, central banks and governments might implement significant fiscal and monetary stimulus. Such actions can lead to increased debt issuance at longer durations - considering the benefit of locking in the government’s interest payments for longer durations at these lower interest rates” (the reality is more complex than this, but it’s a consideration nonetheless with debt to GDP at astronomical levels)
What tends to happen in this situation is bonds are bought as the economy weakens.
This increased demand for safe US treasuries that is more significant at the front end of the curve (2 year, for example) results in yields across all durations heading lower, yet yields at the front end (which most closely anticipate shorter term moves in the policy rate) go down significantly more. The curve shifts downwards as yields fall but shorter duration treasuries see more aggressive buying, pricing in more immediate cuts and disinflation, and this results in the “bull steepener”. Bull steepeners oftentimes are correlated with declining stock prices, but not always.
The Briefly Lived Post-SVB/Credit Suisse Collapse Bull Steepener, which caught many Global Macro players unaware after a year of excellent profits on the Bear Flattener
The COVID Q1 2020 Bull Steepener
If you’re of a mind that the US economy avoids a recession entirely and enters a booming economy, you may say to yourself “4.25% interest sounds like absolute cap, over the course of ten years the economy is going to stay solid and if it’s anything like 2009-2019 then I’ll have this money locked up for ten years in a bond earning four percent while the Nasdaq does a 5x”. And that might entice you to sell your longer term bonds (so that you have more money to buy longer term stonks with).
Maybe, even, you think rates will stay at 5% for the next 5 years as we witness a resurgence in spending and expectations of price increases that cement inflation as structural amidst an economy too resilient for rate hikes to impact.
Maybe, in this scenario, you are the Chief Risk Officer of a regional bank, and you will think “remember that bank everyone was laughing at in March? I’d like to avoid their fate - rates are actually low right now compared to where they’ll be in two or three months time so I should not lock in for ten years and have to experience that drawdown, I will reduce my interest rate risk by moving around my fixed income holdings from 10 year or more duration to 3 month - 2 year.”
You might even be tempted to buy agency MBS instead because of things like “decreasing prepayment risk”, but - being the intelligent risk manager you are - recognize that the more galaxy brained your decisions the more unrelatable your testimony to Congress will be when your bank fails.
In this scenario, you would move to reduce the average duration of your bond portfolio by selling longer duration to buy less volatile shorter duration.
This entails selling that 10 year bond to buy perhaps 2 year treasuries, or 3 month paper even. You still need your assets to generate safe income, but you also want that principal available when rates go to 6% so you can lock it in for the next 30 years and F off to Bali forever (true story that I was told by a friend - there was a guy at his old shop who pounded the table to back up the truck buying long duration cash treasuries in 1982 at 16% in 1981 and then pretty much never did anything again until he retired).
This, along with a million other variables, can result in the “bear steepener”.
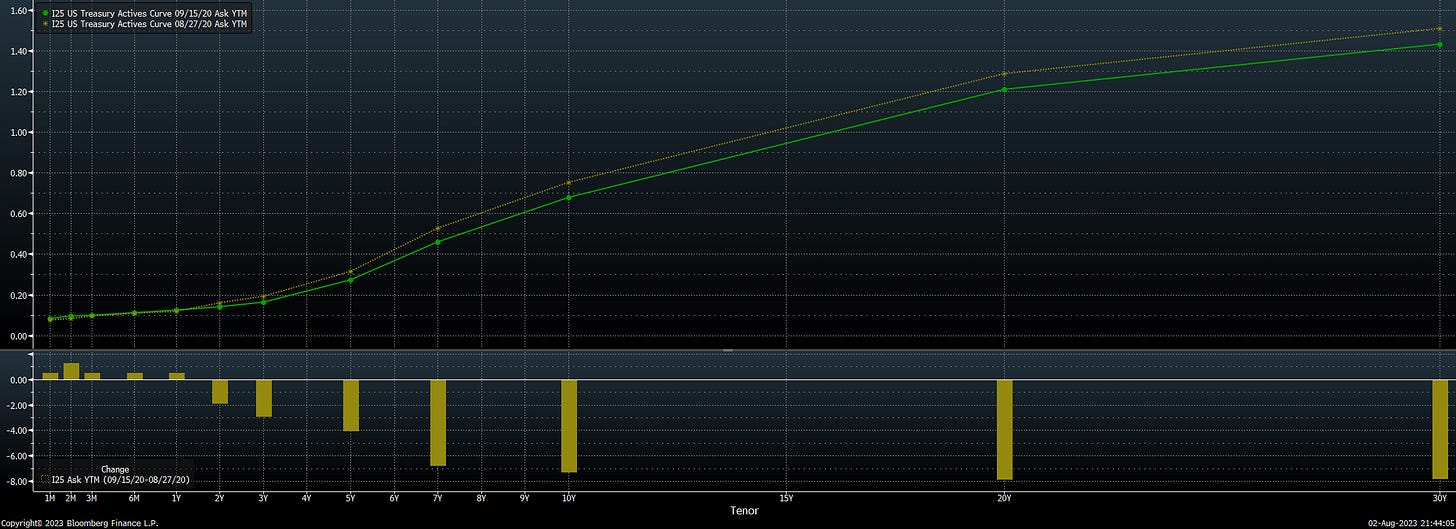
In the response to COVID, Powell’s late-august announcement of a new “average inflation targeting policy” that would keep rates lower for longer amidst concerns of persistently lower inflation resulted in the curve undergoing a “bull flattener” in response. This was partially the result also of bull steepeners being unwound after massive gains. Bull flatteners are typically associated with stronger stock markets, but not always.
So that’s a very brief, very simplistic explanation of how and why the yield curve may shift in the way it does. Inflation and subsequent tightening woes lead to flattening and curve inversion, the resolution of this dynamic in a recession tends to result in a bull steepener while persistently higher inflation due to a resilient economy tends to result in a bear steepener, decreased longer term inflation expectations and modest economic prospects can lead to a bull flattener.
Adjusting Curve Trades for Convexity & Duration
Although it would be difficult to not be aware of this after 2022, the net present value of a bond’s cash flows are always approximately reflected by the price, meaning that if interest rates go up significantly then the effect on the price of a two year bond and/or a bond with a very high coupon is going to be less significant than the effect on the price of, for example, a 30 year bond and/or a bond with a high coupon. This is called convexity, and it cuts both ways.
Using a rough and dirty real life example from this year, we can see how a 50 basis point rise in interest rates for the 3 year duration bond with a 3.625% coupon resulted in the value of the bond decreasing by 1.29%. However, the same coupon bond with a 20 year duration experiencing a 50 basis point rise in interest rates sees a decline of 13.5%. This is called “convexity”. You can capture convexity in various ways using flies and curve trades but it’s typically important to be duration neutral.
For example, if we wish to position ourselves for a flatter 2s10s yield curve we cannot simply show up, short 1MM notional of 2 year bonds, buy 1MM notional of 10 year bonds and sit back to find out if we’re going to make money.
In order to implement a yield curve trade properly one must weight each tenor to ensure that you are not just mostly long one duration with a short on another. When using futures, this changes based on the cheapest to deliver treasury represented by the contract.
In order to have your PnL match the change in the yield curve (measured as DV01, or the dollar value of 1 basis point) you need to use the correct ratio.
For example, if I wanted to put on the 2s10s steepener right now using two year futures and ten year futures, I would have to determine the correct ratios. As mentioned earlier, the 2s10s steepener involves buying the 2 year and selling the 10 year. Since the trade should only be sensitive to the curve, the positioning is the same for a bear steepener as it is for a bull steepener. It doesn’t matter if the curve shifts higher (because of a stronger economy) or lower (because of recession fear).
The notional of the 2 year note future is twice that of the ten year note future, so the number of two year notes needed for every 100 ultra ten year note future contracts is 252 (half the the “hedge ratio”, or amount of two year notional cash treasuries as a ratio to the amount of notional ten year) .
I think that curve trades provide payoff scenarios that are difficult to find elsewhere without running into idiosyncrasies of equities and commodities that may not fit a purely economic thesis and that it benefits any investor to understand how they work so they might have a better picture of how the market is positioning and anticipating the future.
TRADE UPDATE:
The update for the positioning mentioned in the paid subscriber chat is behind a paywall:
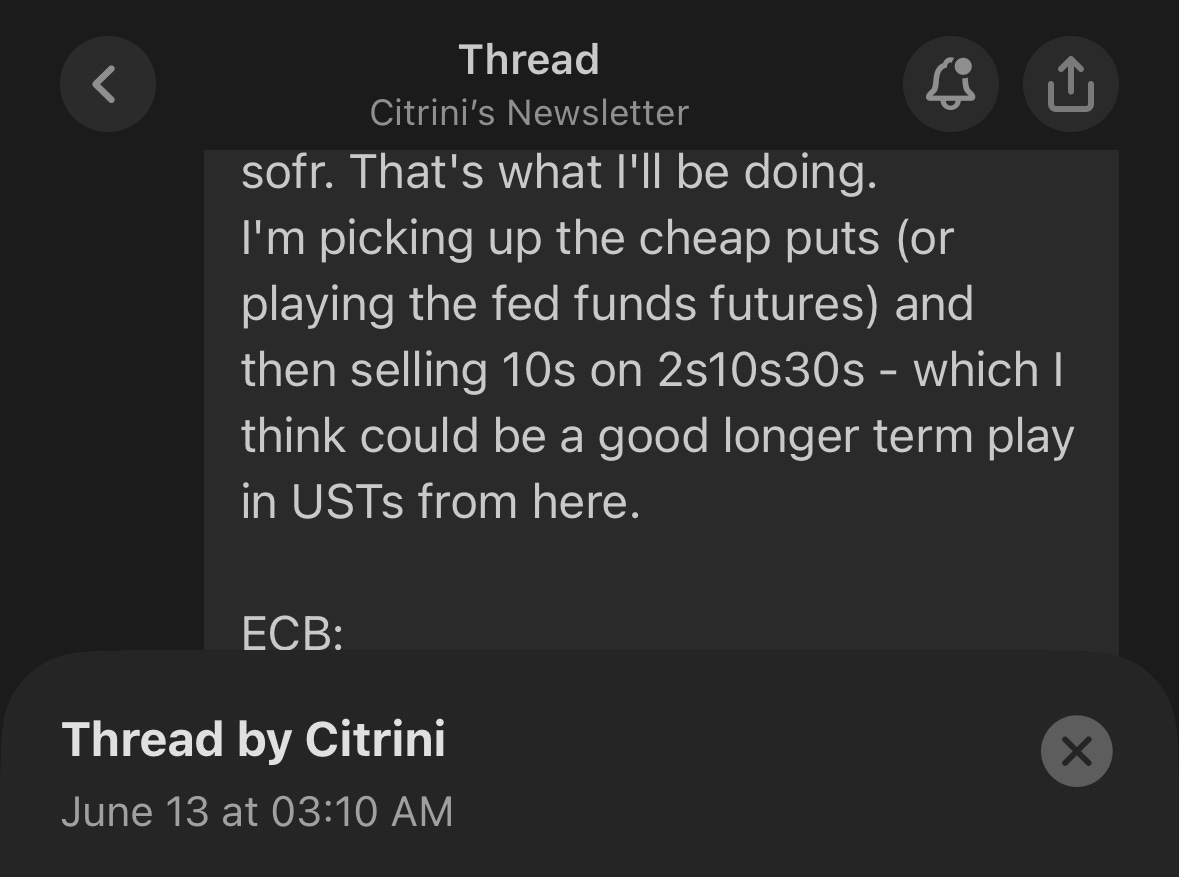
2s10s30s Fly Play
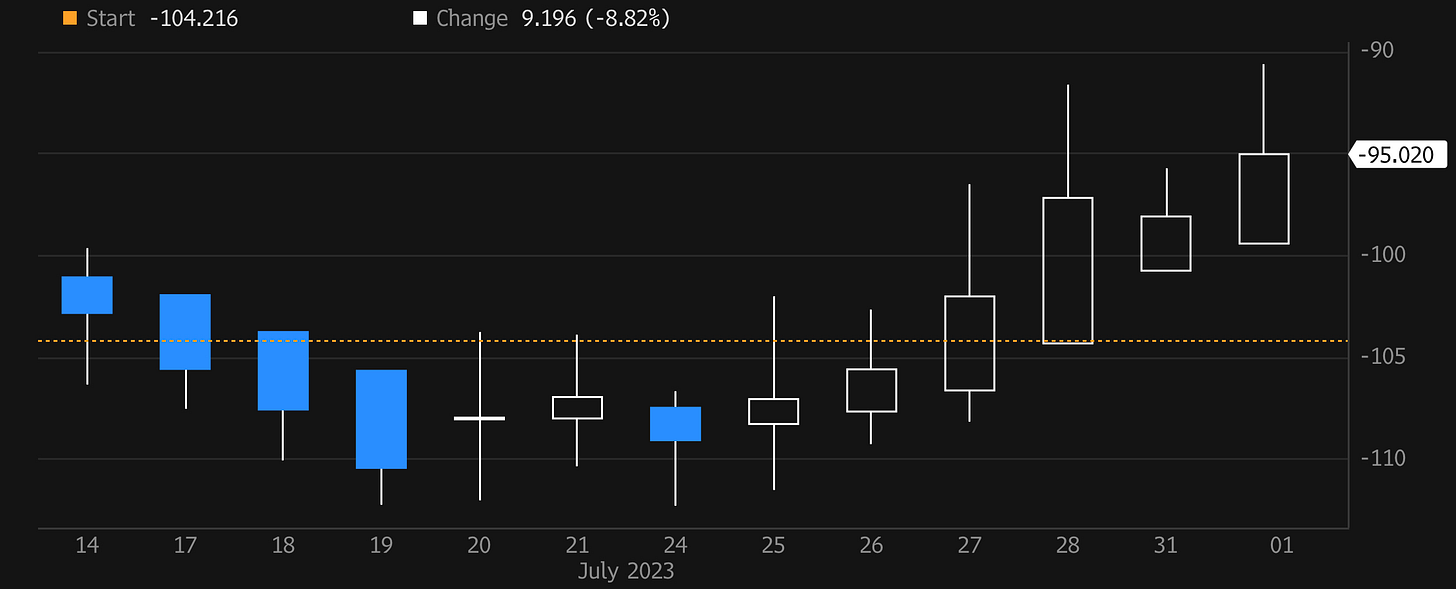
2s10s30s Fly since Entering (7/14-7/17 avg entry)
I mentioned on July 13th & 14th in the chat that I’d be looking to sell 10s on the 2s10s30s fly (2s10s steepener + 10s30s flattener) below -100bps, I figured now was a good time for an update.
The first entry was at -100bps and I brought it up to a full position on Tuesday July 19th for an average entry of -103bps. It’s up ~14bps, which is less than it would be if I had had the 2s10s steepener on, but I like this trade because of the convexity - rates are going higher right now in a bear steepener and this trade is benefitting from that, but if rates begin falling in a bull steepener this will likely benefit much more. The 2s10s30s fly is at historically inverted levels and between Japanese Yield Curve Control Adjustment steepening 2s10s curves across Developed Markets I like the optionality this provides. You can always dump the 10s30s flattener and ride the steepener if things accelerate, but for now I still think that the 30 year ends up getting bought and juices this a bit more. It’s been going pretty decently so far:
Yield Curve Since Entering
2s10s30s Butterfly Spread Since entering
Notional PnL at 10k DV01 w/ SL and TP Targets
For this trade, in order to maintain a DV01 of $10,000, you’d:
BUY +272 Two Year Note Futures (TUU3 / ZTU2023)
SHORT -216 Ten Year Ultra Futures (UXYU3 / TNU2023)
BUY +48 Treasury Ultra Bond Futures (WNU3 / UBU2023)
Divide by 10 for a DV01 of $1000 (i.e. for every basis point the 2s10s30s curve moves, your PnL moves by $1000).
Because, as explained, this trade is simply a 10s30s flattener + a 2s10s steepener, you can play around with legging in or run exposure to one leg larger than the other. I would say right now the steepener is more valuable than the flattener, as the 30 year tenor has been under pressure due to the treasury issuance news recently being larger than expected.
More craziness today.
I’ve read two books about fixed income in my life. The first was Fabozzi’s “Handbook of Fixed Income Securities”, the second was “The Ultimate Tourist’s Guide to Bondistan” by @effmkthype. The latter was much better and I highly recommend it if you want to get a great bond education.
If you’re me, someone who (as referenced by the title) is an idiot







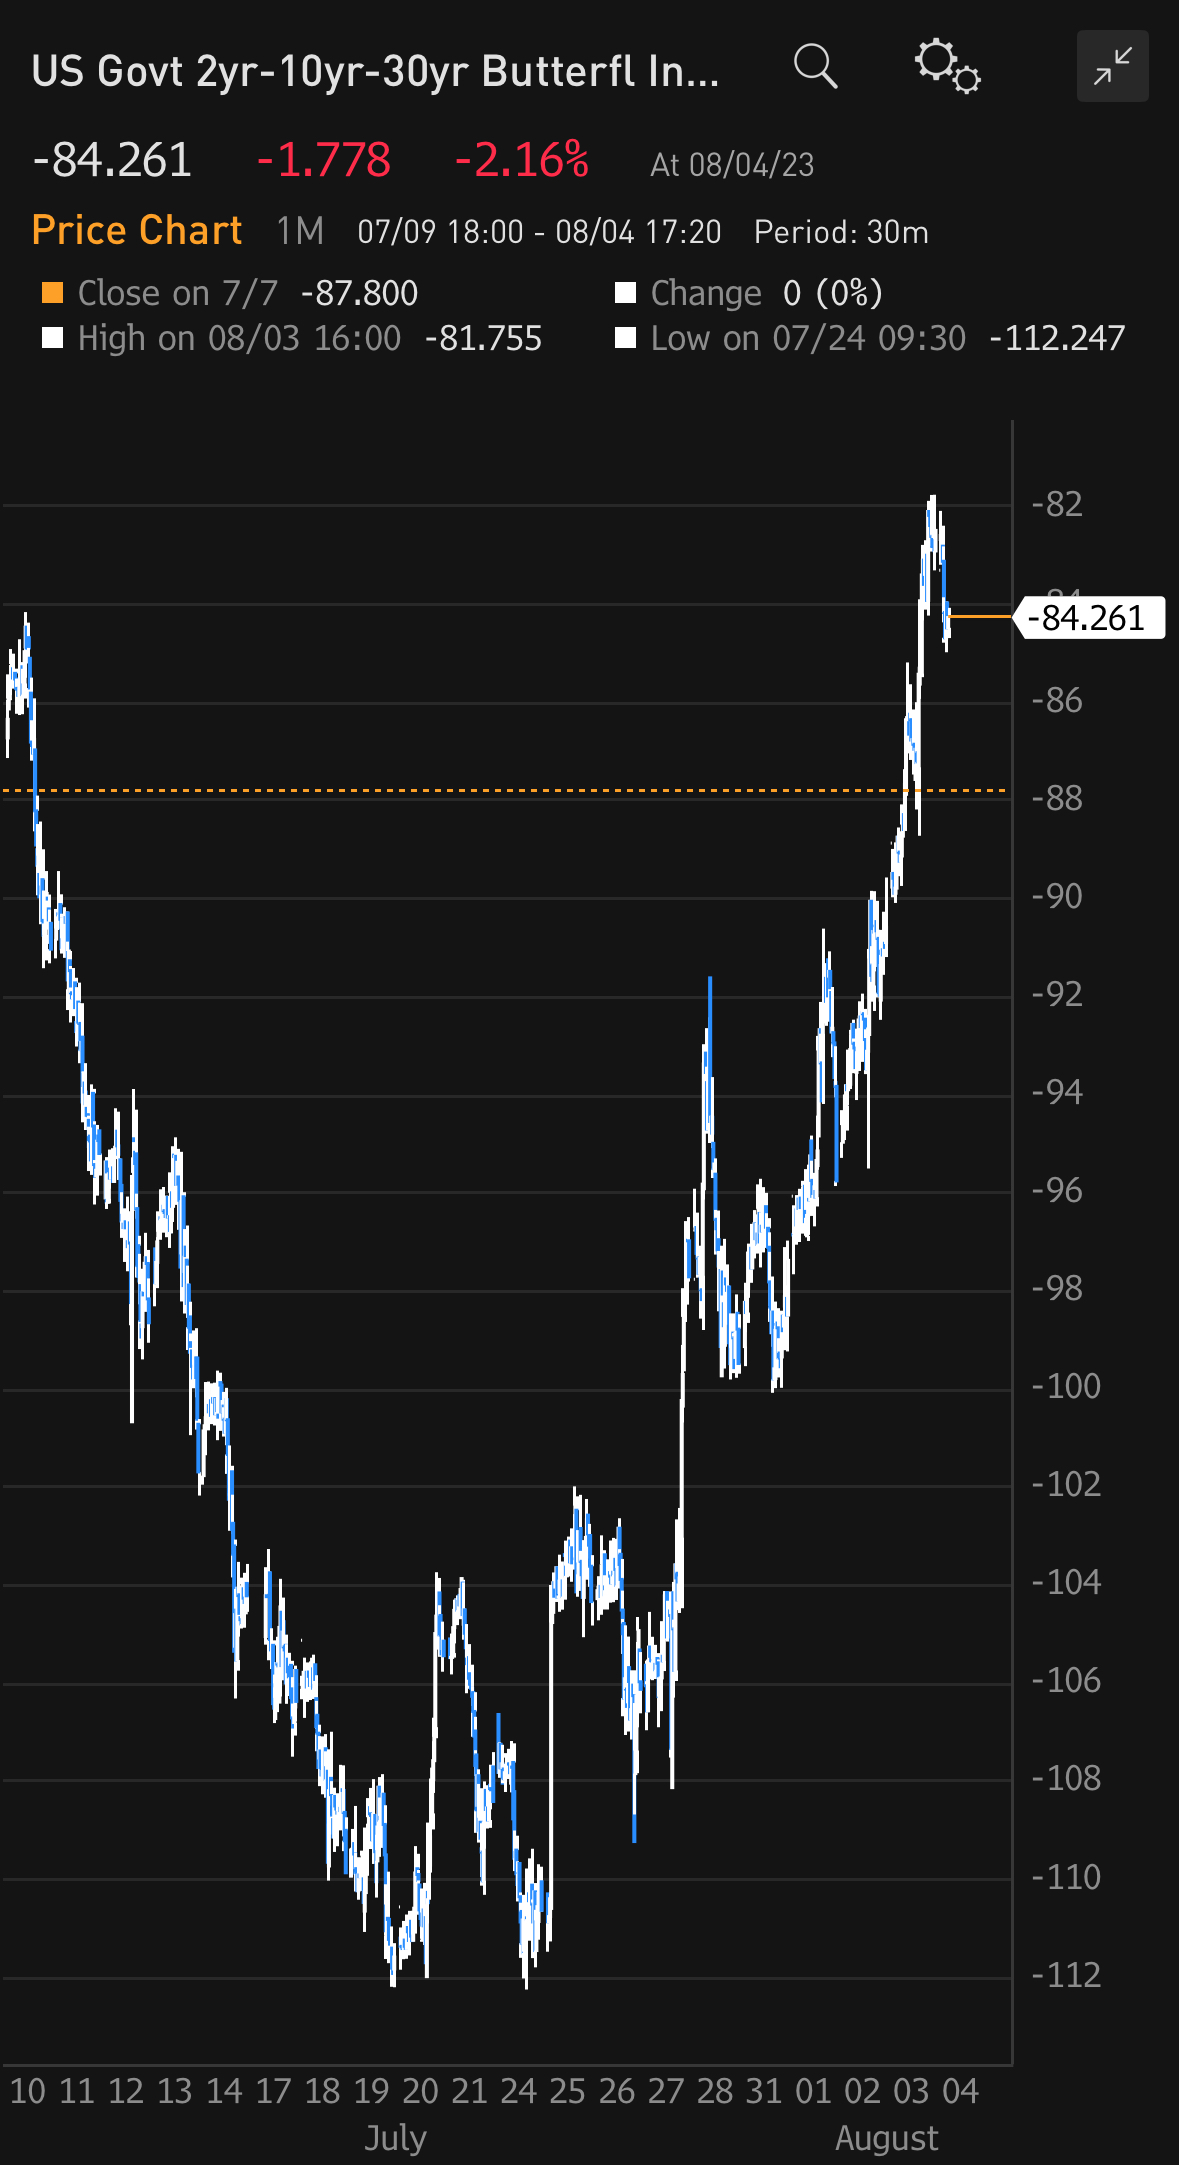
2s10s30s fly has been an insane trade. +23bps in the span of a few days, I’m getting out of about half of it here and putting a stop at the entry.
This is an amazing write up. Thank you for this